
Polkadot has recently witnessed a surge in demand, leading to a price uptick that has breached its previous swing high and broken through a multi-month descending trendline. The price is now approaching the upper boundary of its consolidation range and is on the brink of surpassing it.
Technical Analysis
By Shayan
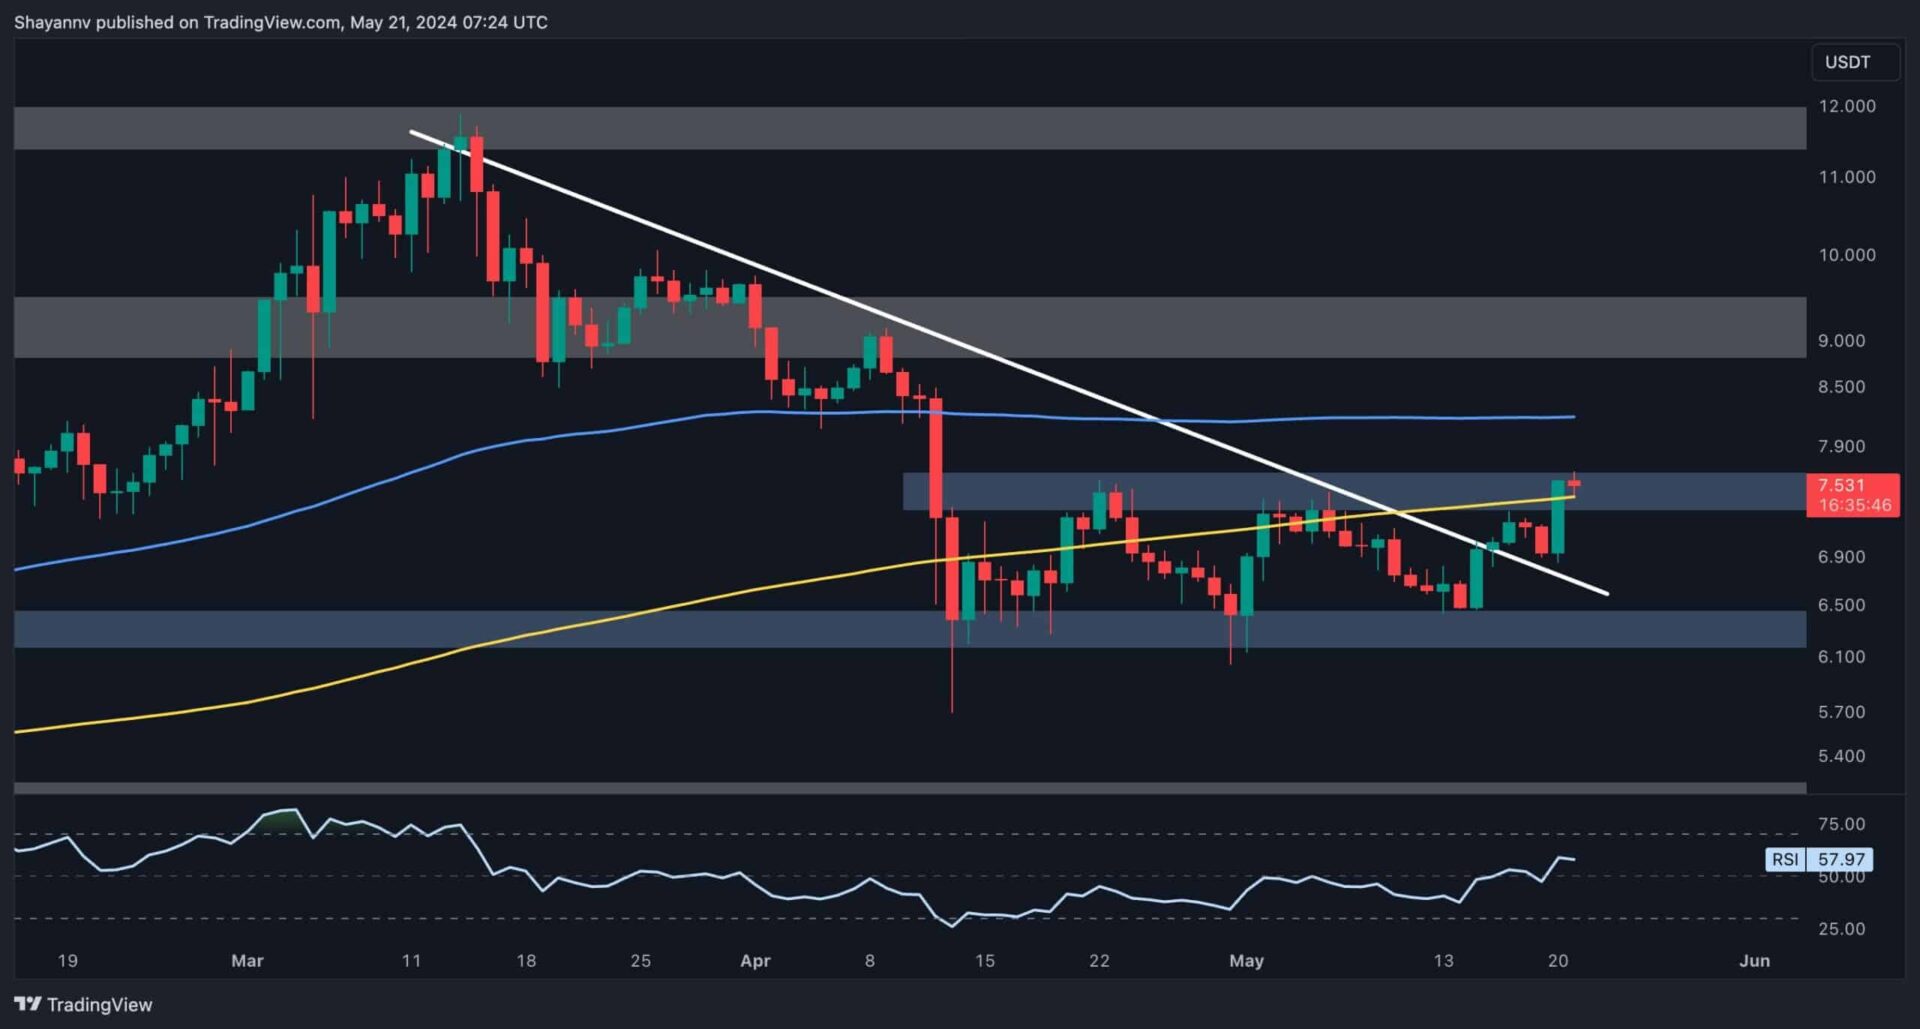
The Daily Chart
A detailed analysis of Polkadot’s daily chart shows that after a prolonged phase of sideways consolidation, a renewed spike in demand has pushed the price higher. This surge has allowed Polkadot to break through several key resistance levels, including a descending multi-month trendline, the prior swing high of $7.47, and the 200-day moving average.
Now, the price is approaching the upper boundary of this long-standing range and is on the verge of breaking above it.
If the buyers manage to push above this range, it could signal the beginning of a sustained bullish trend. However, if selling pressure intensifies, a bearish reversal towards the lower boundary is possible. The price action around this crucial resistance zone will determine Polkadot’s short-term trajectory.
The 4-Hour Chart
In the 4-hour timeframe, Polkadot’s recent bullish momentum is more evident, with the price experiencing a 12% impulsive spike towards a significant resistance area.
This critical range is bounded by the 0.5 ($7.415) and the 0.618 ($7.821) Fibonacci levels. Nevertheless, the price has been fluctuating within an ascending wedge pattern for an extended period, and following the recent surge in demand, it is now slightly retracing towards its upper boundary.

If the buyers can breach the substantial resistance at $7.8, the next target will be the upper boundary of the wedge in the mid-term.
Conversely, a bearish reversal could lead to another downward move, aiming for the wedge’s lower boundary. A decisive breakout from the wedge pattern is necessary to determine Polkadot’s upcoming direction.
Sentiment Analysis
By Shayan
Polkadot’s price has recently experienced a notable surge, raising expectations of a potential mid-term bullish trend. Hence, analyzing the futures market sentiment is crucial to assess whether this uptrend will persist, as futures market positions are significant drivers of volatility.
This chart illustrates the funding rate and open interest metrics alongside Polkadot’s daily price movements. Despite the recent bullish surge, both open interest and funding rates have not shown a significant increase and remain near their lowest levels. This suggests that the recent price action was not driven by increased bullish activity in the perpetual markets.
While Polkadot’s price has surged, the sustainability of this uptrend depends on the futures market sentiment. If open interest and funding rates begin to rise, it will signal strong bullish momentum, potentially solidifying the uptrend. Conversely, if these metrics remain low, the uptrend may lack the necessary support for long-term continuation. Traders should closely watch these indicators to better understand the market’s direction in the coming weeks.
Binance Free $600 (CryptoPotato Exclusive): Use this link to register a new account and receive $600 exclusive welcome offer on Binance (full details).
LIMITED OFFER 2024 at BYDFi Exchange: Up to $2,888 welcome reward, use this link to register and open a 100 USDT-M position for free!
Disclaimer: Information found on CryptoPotato is those of writers quoted. It does not represent the opinions of CryptoPotato on whether to buy, sell, or hold any investments. You are advised to conduct your own research before making any investment decisions. Use provided information at your own risk. See Disclaimer for more information.
Cryptocurrency charts by TradingView.