

In recent months, Ethereum has experienced a significant surge in price, surpassing multiple resistance levels. However, the bullish momentum appears to be fading, and the cryptocurrency is currently having difficulty in continuing its upward trend. As of now, ETH is struggling to maintain its position and surpass a significant resistance region.
Technical Analysis
By Shayan
The Daily Chart
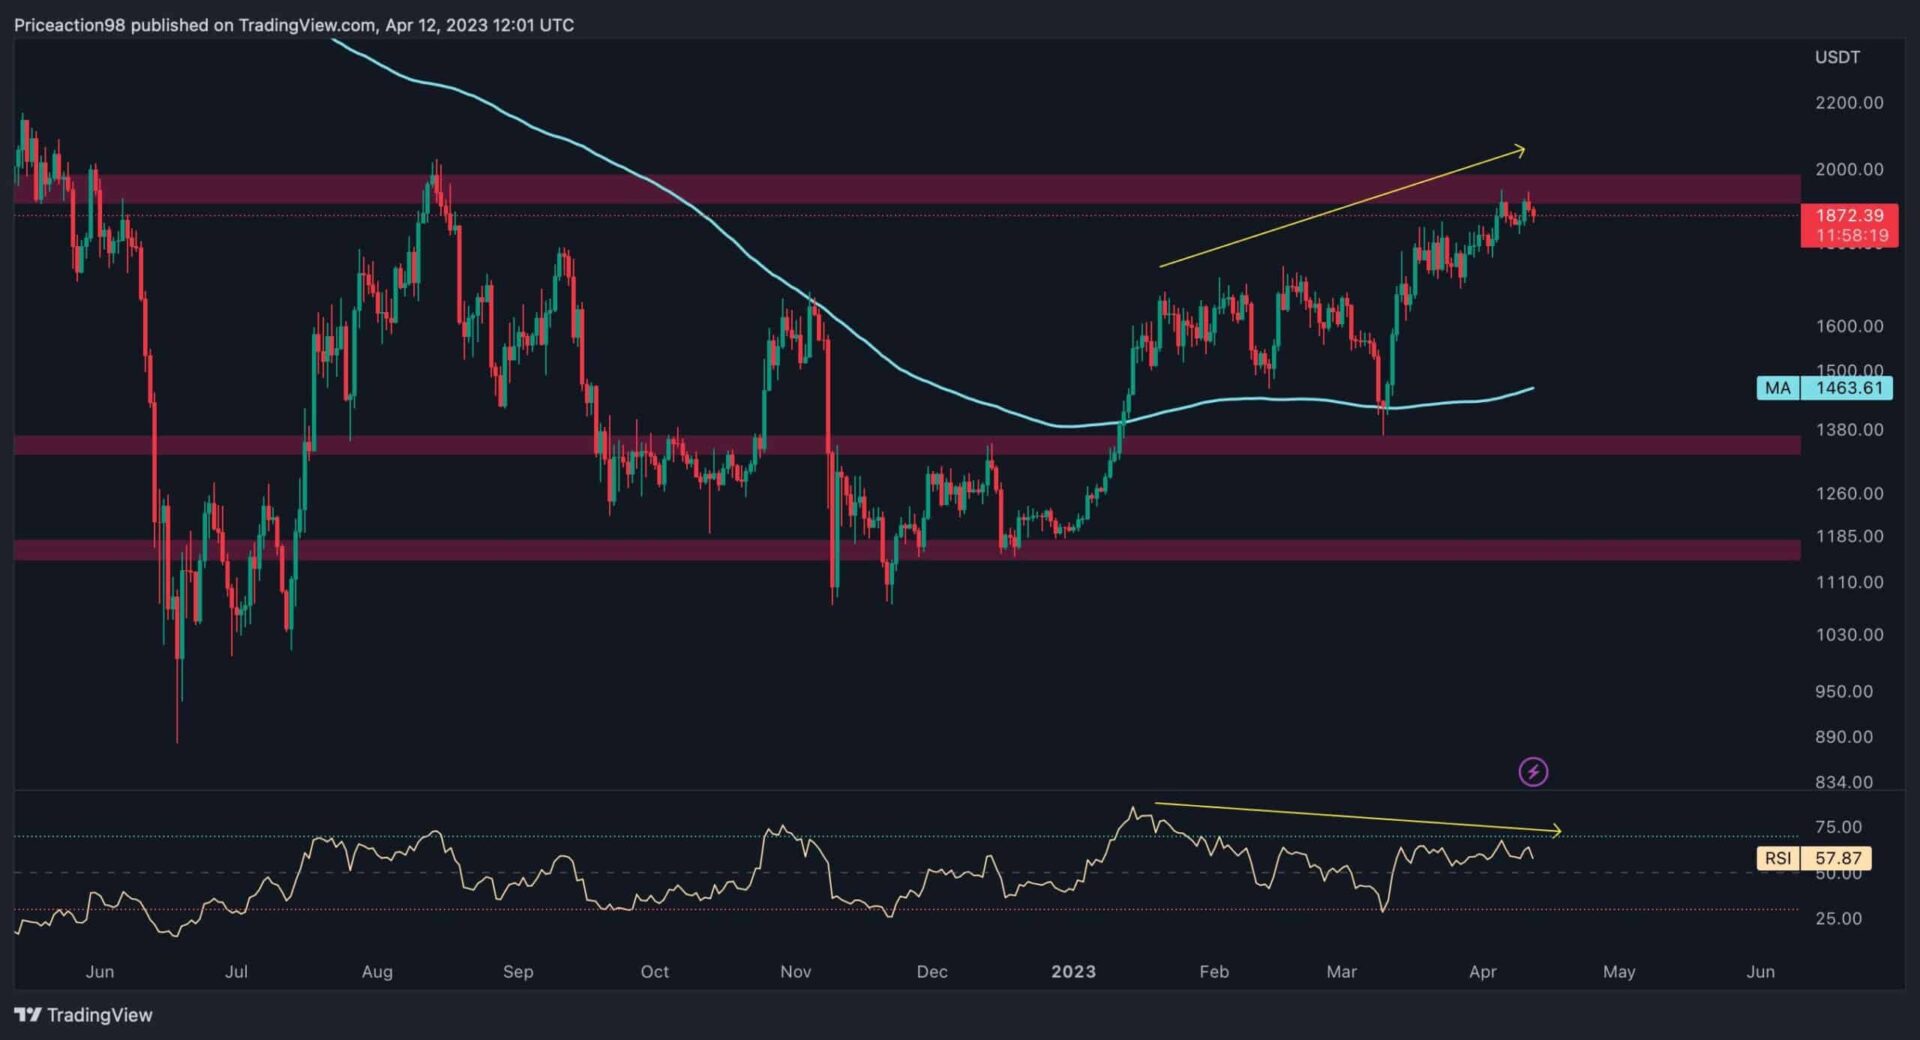
In March 2023, Ethereum’s price saw a significant rally when it found support at the 200-day moving average of $1.4K. However, as the price approached the crucial resistance level of $2K, the bullish momentum began to wane.
Because of that, the strength of the $2K resistance zone, and the divergence between the price and the RSI indicator, ETH seems more likely to enter a consolidation correction zone soon. It’s essential to keep a close eye on the RSI indicator, as it’s nearing the overbought zone, which could increase the chances of a correction or reversal.
The 4-Hour Chart
The rally came to a halt when it reached the upper trendline of the ascending channel in the 4-hour timeframe. Although the price tried to surpass the trendline a second time, it was rejected, leading to a slight drop. If the cryptocurrency manages to break through the $2K resistance region and the upper threshold of the channel, it could spark a bullish rally toward the next resistance level.
However, if the price declines, the mid-boundary of the channel and the $1.7K level will serve as crucial support zones. Notably, ETH has formed a double-top price action pattern at the $2K resistance region, confirming the bearish scenario.
By Shayan
Ethereum’s price has increased in recent months, approaching the $2,000 level. While some investors are optimistic that the bear market is ending, the futures market shows a concerning signal.
This chart displays the Taker Buy Sell ratio for Ethereum, which determines whether the bulls or the bears are executing their orders more aggressively and helps forecast short-term market movements. Positive values are considered bullish, while negative ones are interpreted as bearish.

Currently, the Taker Buy Sell ratio has been consistently decreasing and has fallen below zero. This suggests that a pullback or even a reversal in Ethereum’s value may occur in the following weeks. It is important to monitor this metric closely as it provides valuable insights for the short term.
Binance Free $100 (Exclusive): Use this link to register and receive $100 free and 10% off fees on Binance Futures first month (terms).
PrimeXBT Special Offer: Use this link to register & enter CRYPTOPOTATO50 code to receive up to $7,000 on your deposits.
Disclaimer: Information found on CryptoPotato is those of writers quoted. It does not represent the opinions of CryptoPotato on whether to buy, sell, or hold any investments. You are advised to conduct your own research before making any investment decisions. Use provided information at your own risk. See Disclaimer for more information.
Cryptocurrency charts by TradingView.