ETH/USD – Ether Remains Inside Consolidaiton Pattern
Key Support Levels: $2333, $2200, $2000.
Key Resistance Levels: $2470, $2600, $2700.
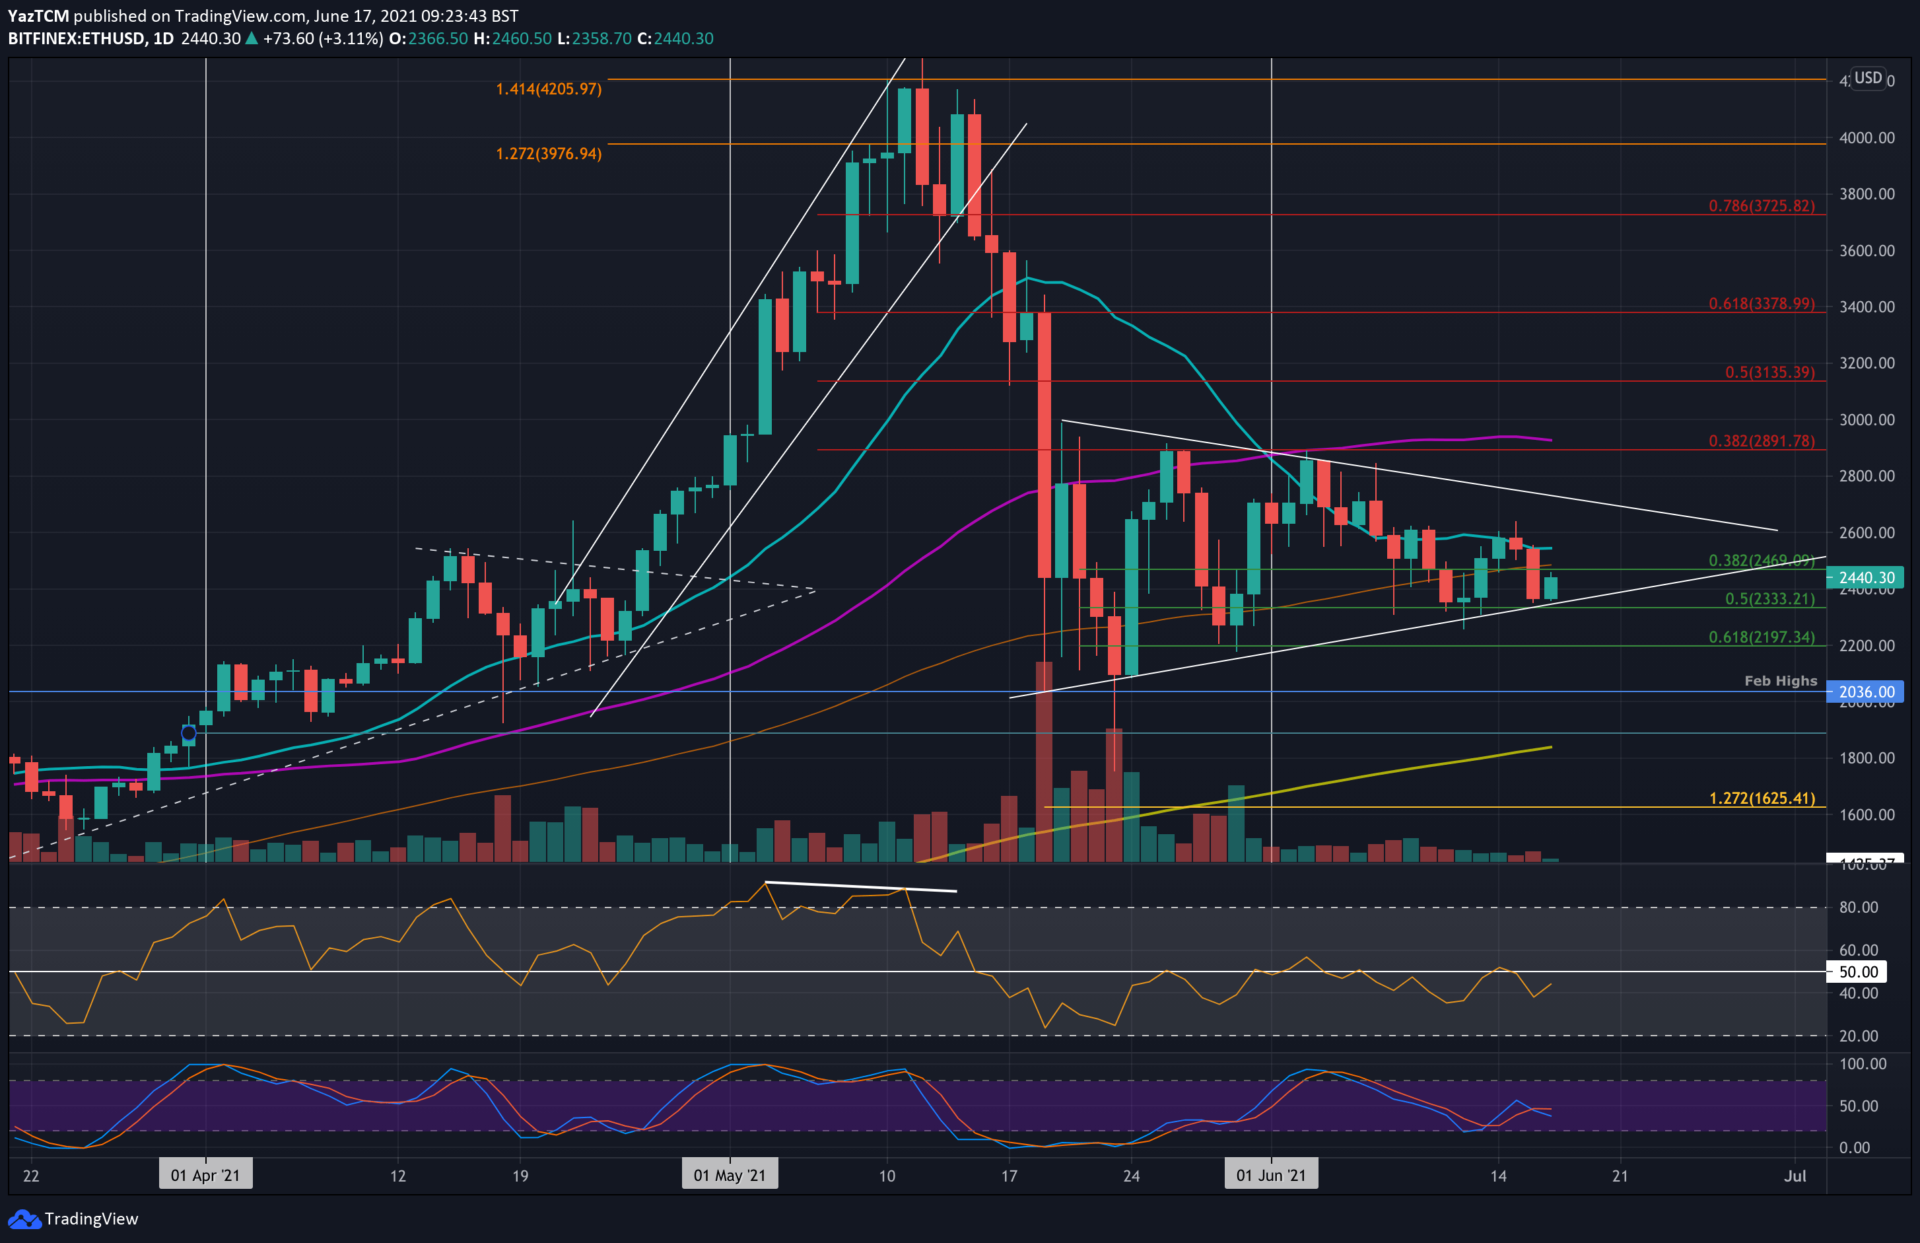
Ethereum attempted to break resistance at $2600 at the beginning of this week but fell short at the 20-day MA there. It rolled over from there on Tuesday and headed toward the lower boundary of the currency symmetrical triangle pattern.
ETH has been trading inside this triangle for almost a month, and a breakout of the pattern would determine the next direction for the market.
ETH-USD Short Term Price Prediction
Looking ahead, the first support lies at $2333 (.5 Fib & the triangle’s lower boundary). This is followed by $2200 (.618 Fib), $2000 (Feb 2021 highs), and $1800.
On the other side, the first resistance lies at $2470 (100-day MA). This is followed by $2600, $2700 (triangles upper boundary), and $2800.
The RSI remains beneath the midline, indicating weak bearish momentum. If it dips beneath the 40 level, the increased bearish momentum is likely to drive ETH beneath the current triangle.
ETH/BTC – ETH Continues To Bleed vs. BTC
Key Support Levels: 0.06 BTC, 0.056 BTC, 0.0541 BTC.
Key Resistance Levels: 0.0628 BTC, 0.068 BTC, 0.07 BTC.
Since testing resistance at 0.077 BTC (1.414 Fib Extension) at the start of June, ETH has been in a consistent downtrend against BTC. The coin originally attempted to defend 0.07 BTC (20-day MA) but fell beneath there last week to find support at 0.0628 BTC.
Yesterday, ETH slipped beneath the support at 0.0628 BTC and reached as low as 0.0615 BTC. The break of last week’s support hints that ETH might be heading back to 0.06 BTC.
ETH-BTC Short Term Price Prediction
Looking ahead, the first support lies at 0.06 BTC. This is followed by 0.056 BTC, 0.0541 BTC, and 0.052 BTC (100-day MA).
On the other side, the first resistance lies at 0.0628 BTC. This is followed by 0.068 BTC (50-day MA), 0.07 BTC, and 0.0737 BTC (bearish .618 Fib).
The daily RSI is showing signs of bullish divergence as it makes higher lows while the price makes higher highs. If this plays out, ETH could be expected to head higher from here.
Binance Futures 50 USDT FREE Voucher: Use this link to register & get 10% off fees and 50 USDT when trading 500 USDT (limited offer).
PrimeXBT Special Offer: Use this link to register & enter POTATO50 code to get 50% free bonus on any deposit up to 1 BTC.
Disclaimer: Information found on CryptoPotato is those of writers quoted. It does not represent the opinions of CryptoPotato on whether to buy, sell, or hold any investments. You are advised to conduct your own research before making any investment decisions. Use provided information at your own risk. See Disclaimer for more information.
Cryptocurrency charts by TradingView.


