
Ethereum is showing strong bullish momentum, driven by an influx of buyers. However, as the price nears a significant resistance level at $4K, market participants should anticipate a period of consolidation with the potential for heightened volatility.
Technical Analysis
By Shayan
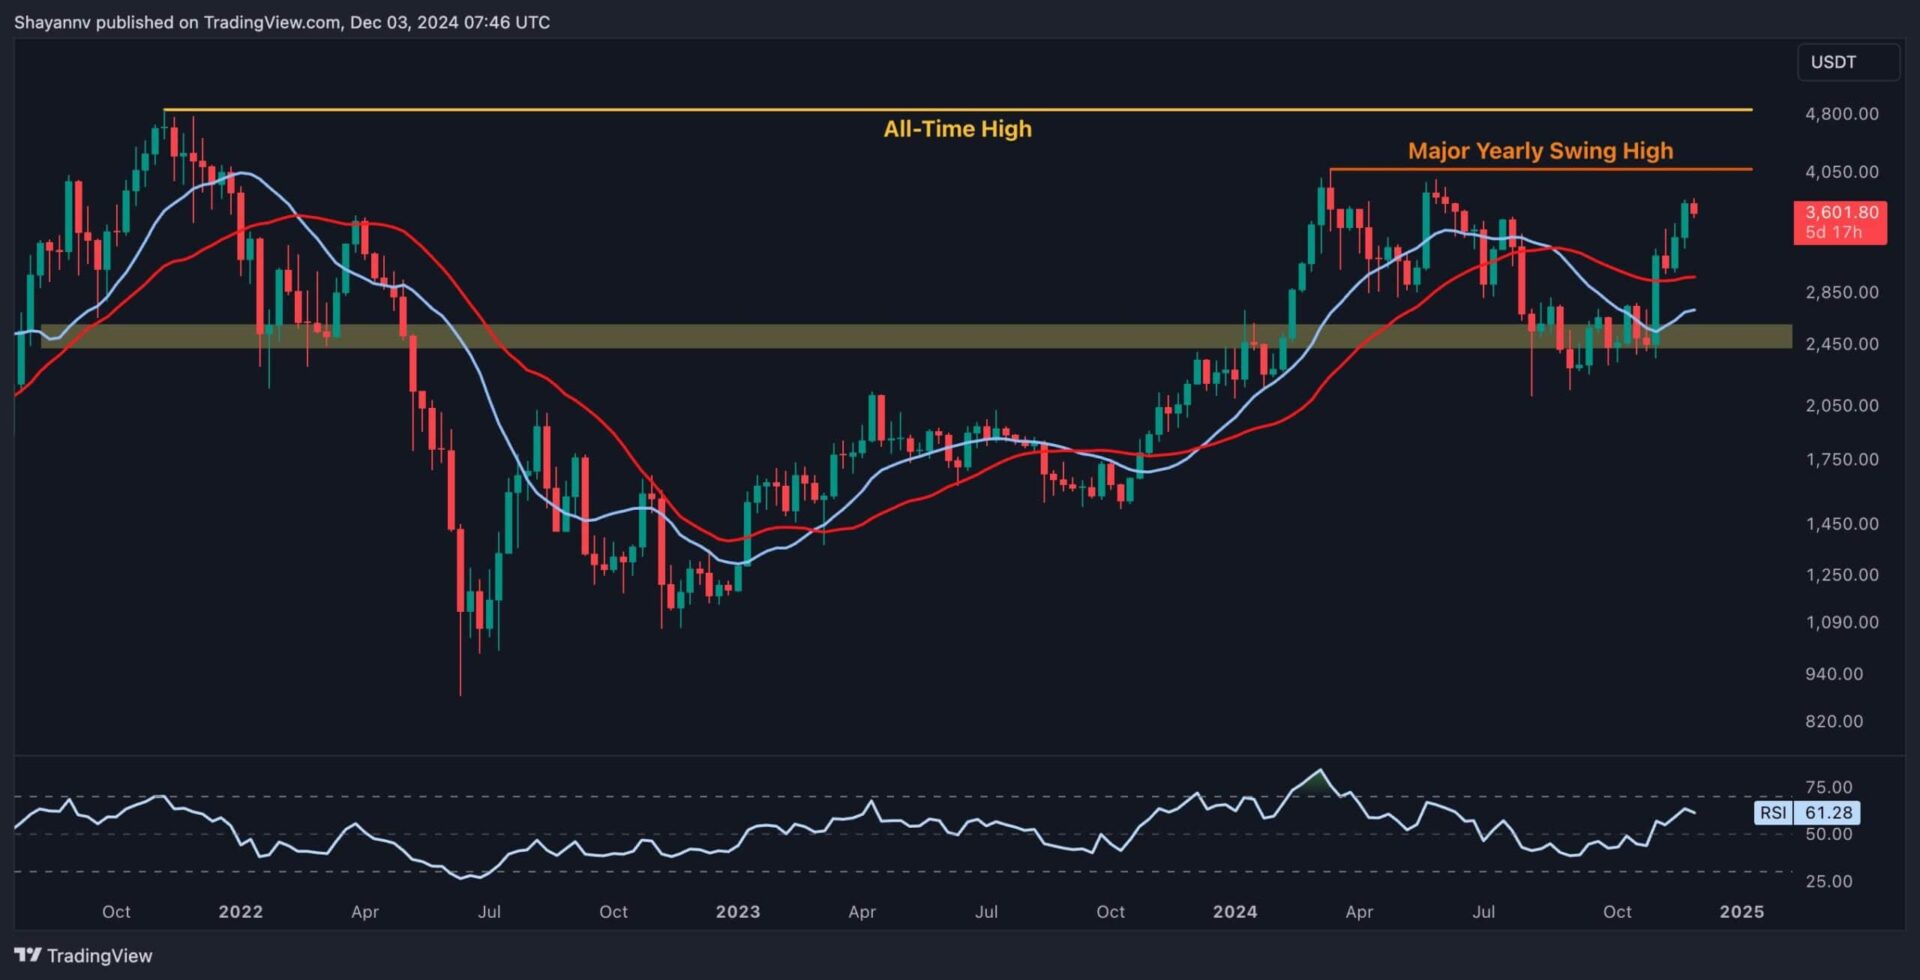
The Weekly Chart
Ethereum has experienced an impulsive uptrend, fueled by buying activity near the $2.5K support region. This movement has led to a breakout above the key 100-day and 200-day moving averages, signaling a shift in market sentiment and confirming the buyers’ dominance. The asset is approaching the $4K resistance zone, a crucial psychological and technical level, likely filled with substantial supply.
The $4K threshold is a probable distribution zone for long-term holders looking to take profits. A consolidation phase around this level will likely give the market time to absorb selling pressure. However, a liquidity pool above $4K could trigger a short squeeze if breached, potentially driving Ethereum toward its all-time high of $4.9K.
The 4-Hour Chart
On the 4-hour timeframe, ETHs price action reflects a Wyckoff accumulation pattern within the $2K-$2.8K range, culminating in a breakout and an impulsive rally past the $3.5K decisive threshold. The asset has also broken above the upper boundary of a bearish wedge pattern, a bullish signal, and has since completed a pullback.

If this correction holds and buying pressure continues, Ethereum will likely extend its uptrend toward the $4K resistance. However, caution is warranted, as a bearish divergence between the RSI indicator and the price suggests a waning bullish momentum. This divergence indicates that the market may face a period of consolidation before determining its next significant move.
Onchain Analysis
By Shayan
The behavior observed in Ethereum’s price movement, particularly the failure to drop below the $3.3K level, aligns with significant liquidity below that point, as seen in the Binance liquidation heatmap. This liquidity likely consists of stop-loss orders and liquidation prices for large traders, or whales, who actively defend their positions to prevent a cascade of liquidations.
Similarly, the $4K level is another critical juncture with substantial liquidity, likely tied to short positions established in anticipation of resistance. Should the asset breach the $4K level, these shorts may be forced to cover their positions, triggering a short-liquidation cascade. This could lead to an impulsive surge, as those positions are unwound, and the market quickly moves higher.
Binance Free $600 (CryptoPotato Exclusive): Use this link to register a new account and receive $600 exclusive welcome offer on Binance (full details).
LIMITED OFFER for CryptoPotato readers at Bybit: Use this link to register and open a $500 FREE position on any coin!