Technical Analysis
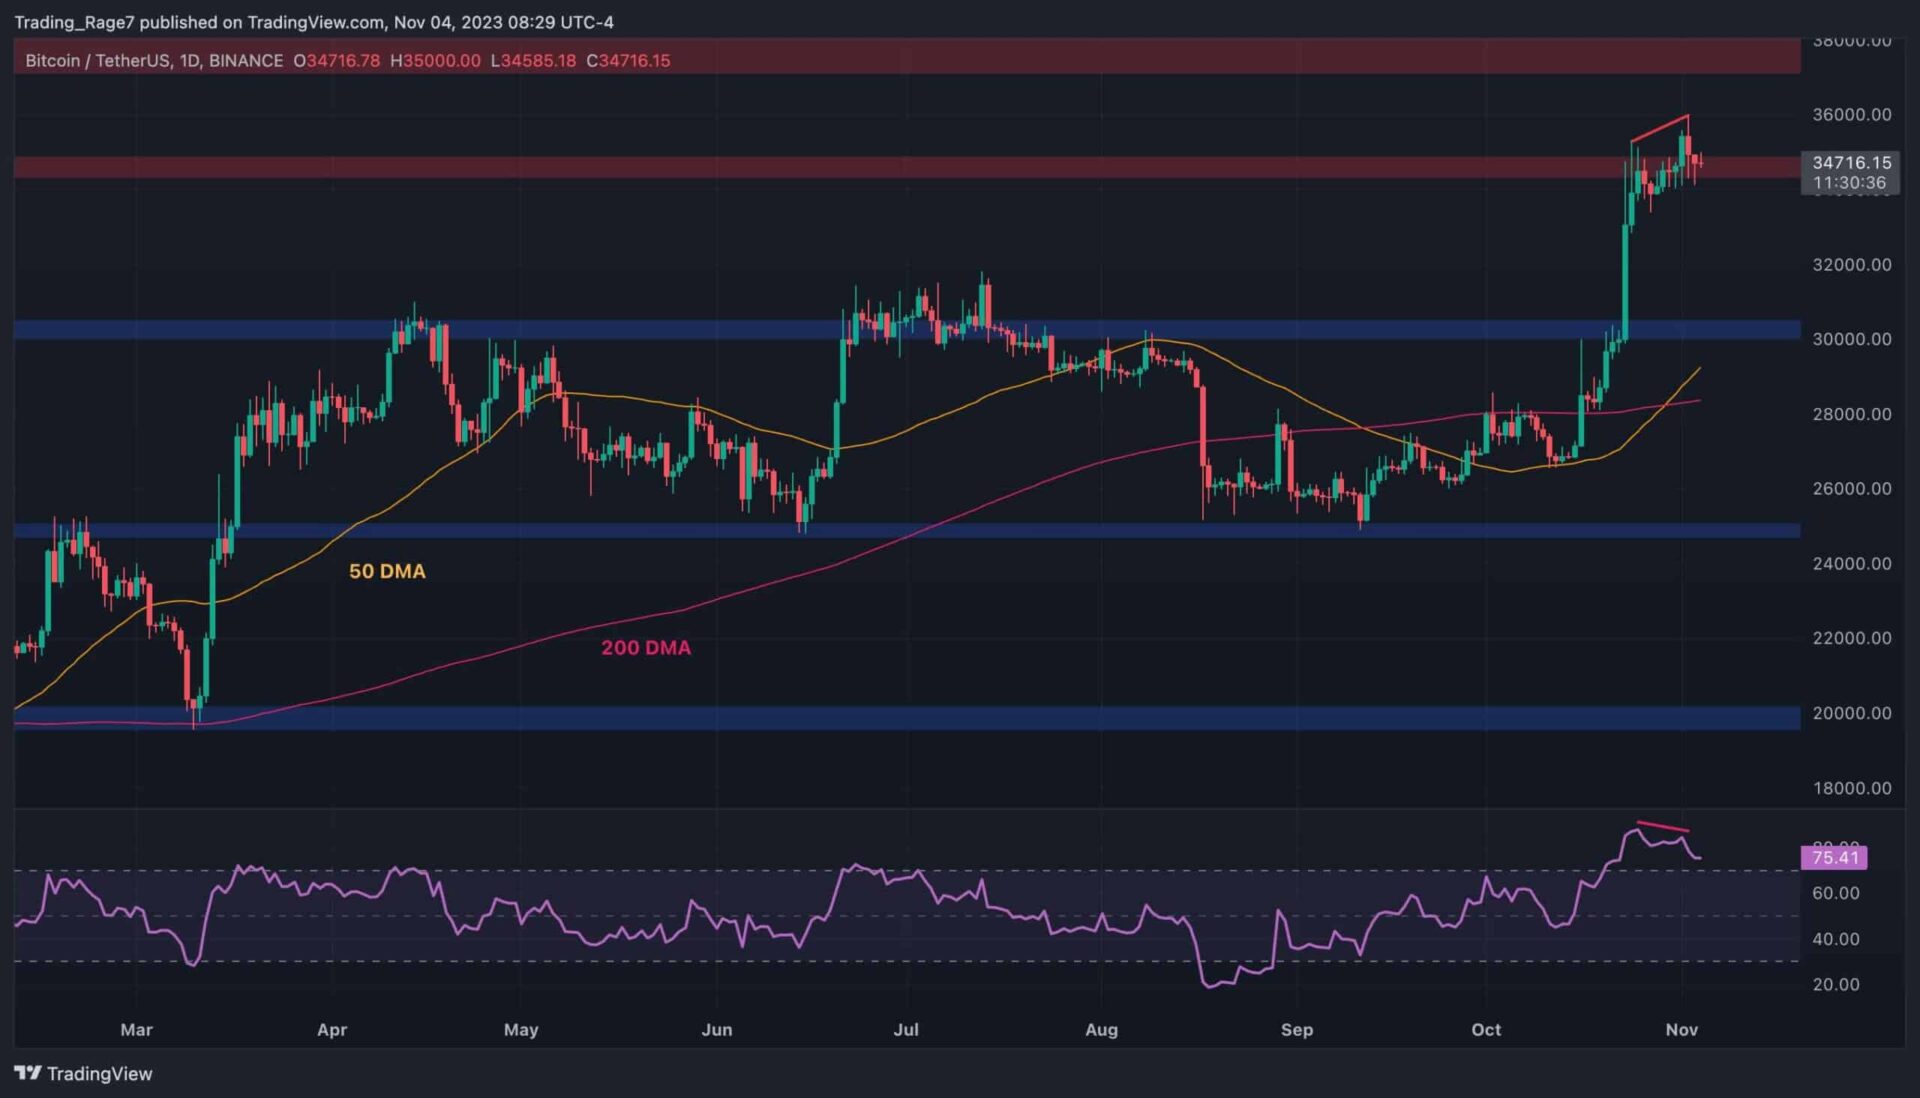
Bitcoin’s price has recently surged above the key $30K resistance level, following a rebound from the $25K support zone. However, a correction seems probable in the short term.
The Daily Chart
On the daily chart, the price has broken through the $30K resistance level and has aggressively rallied toward the $35K area.
Yet, the price is currently consolidating at the mentioned level, pointing to a potential correction in the coming weeks. Moreover, the Relative Strength Index is deep into the overbought territory and also shows a clear bearish divergence between the last two price highs. This signal further boosts the probability of a rejection from the $35K zone.
The 4-Hour Chart
By examining the 4-hour timeframe, the situation becomes more apparent. The market has been creating an ascending channel around the $35K mark, which is a pattern signaling a potential bearish reversal if the price breaks below it.
On the flip side, a bullish breakout above this pattern could trigger a more substantial rally toward the resistance level at $37K. Furthermore, in this timeframe, the Relative Strength Index is hovering around the 50% mark, suggesting that momentum is currently in a state of equilibrium.
Consequently, the outcome is likely to be determined by which direction the market breaks out of the mentioned channel.
On-Chain Analysis
Bitcoin Active Addresses
Bitcoin’s recent rise in price has turned many heads back toward the crypto market. While some assume a new bullish phase has already begun, others might think of the recent rally as another bull trap. Analyzing the underlying fundamentals of the Bitcoin network can provide valuable insight in this occasion, and one of the most prominent network metrics is the number of active addresses.
This chart depicts the 30-day exponential moving average of Bitcoin’s active addresses, which are the number of unique addresses that successfully transacted BTC on the network, either as a sender or receiver.
It is evident that since the beginning of 2023, the number of active addresses has been increasing gradually. This is one of the most influential reasons behind the bullish price action witnessed over the last 9 months. Meanwhile, in case the metric continues its rise, the recent bullish move would likely be sustained. Otherwise, a drop in network activity can be one of the first indicators of a potential bearish reversal.
Binance Free $100 (Exclusive): Use this link to register and receive $100 free and 10% off fees on Binance Futures first month (terms).
PrimeXBT Special Offer: Use this link to register & enter CRYPTOPOTATO50 code to receive up to $7,000 on your deposits.
Disclaimer: Information found on CryptoPotato is those of writers quoted. It does not represent the opinions of CryptoPotato on whether to buy, sell, or hold any investments. You are advised to conduct your own research before making any investment decisions. Use provided information at your own risk. See Disclaimer for more information.
Cryptocurrency charts by TradingView.


