
XRP continues to trade under pressure on both its USDT and BTC pairs, with the broader structure still favoring sellers despite some short-term stabilization near key support levels.

The charts suggest that buyers are trying to defend important demand zones, but the token still needs a convincing breakout above major moving averages and overhead resistance areas before any stronger recovery narrative can take shape.
Ripple Price Analysis: The USDT Pair
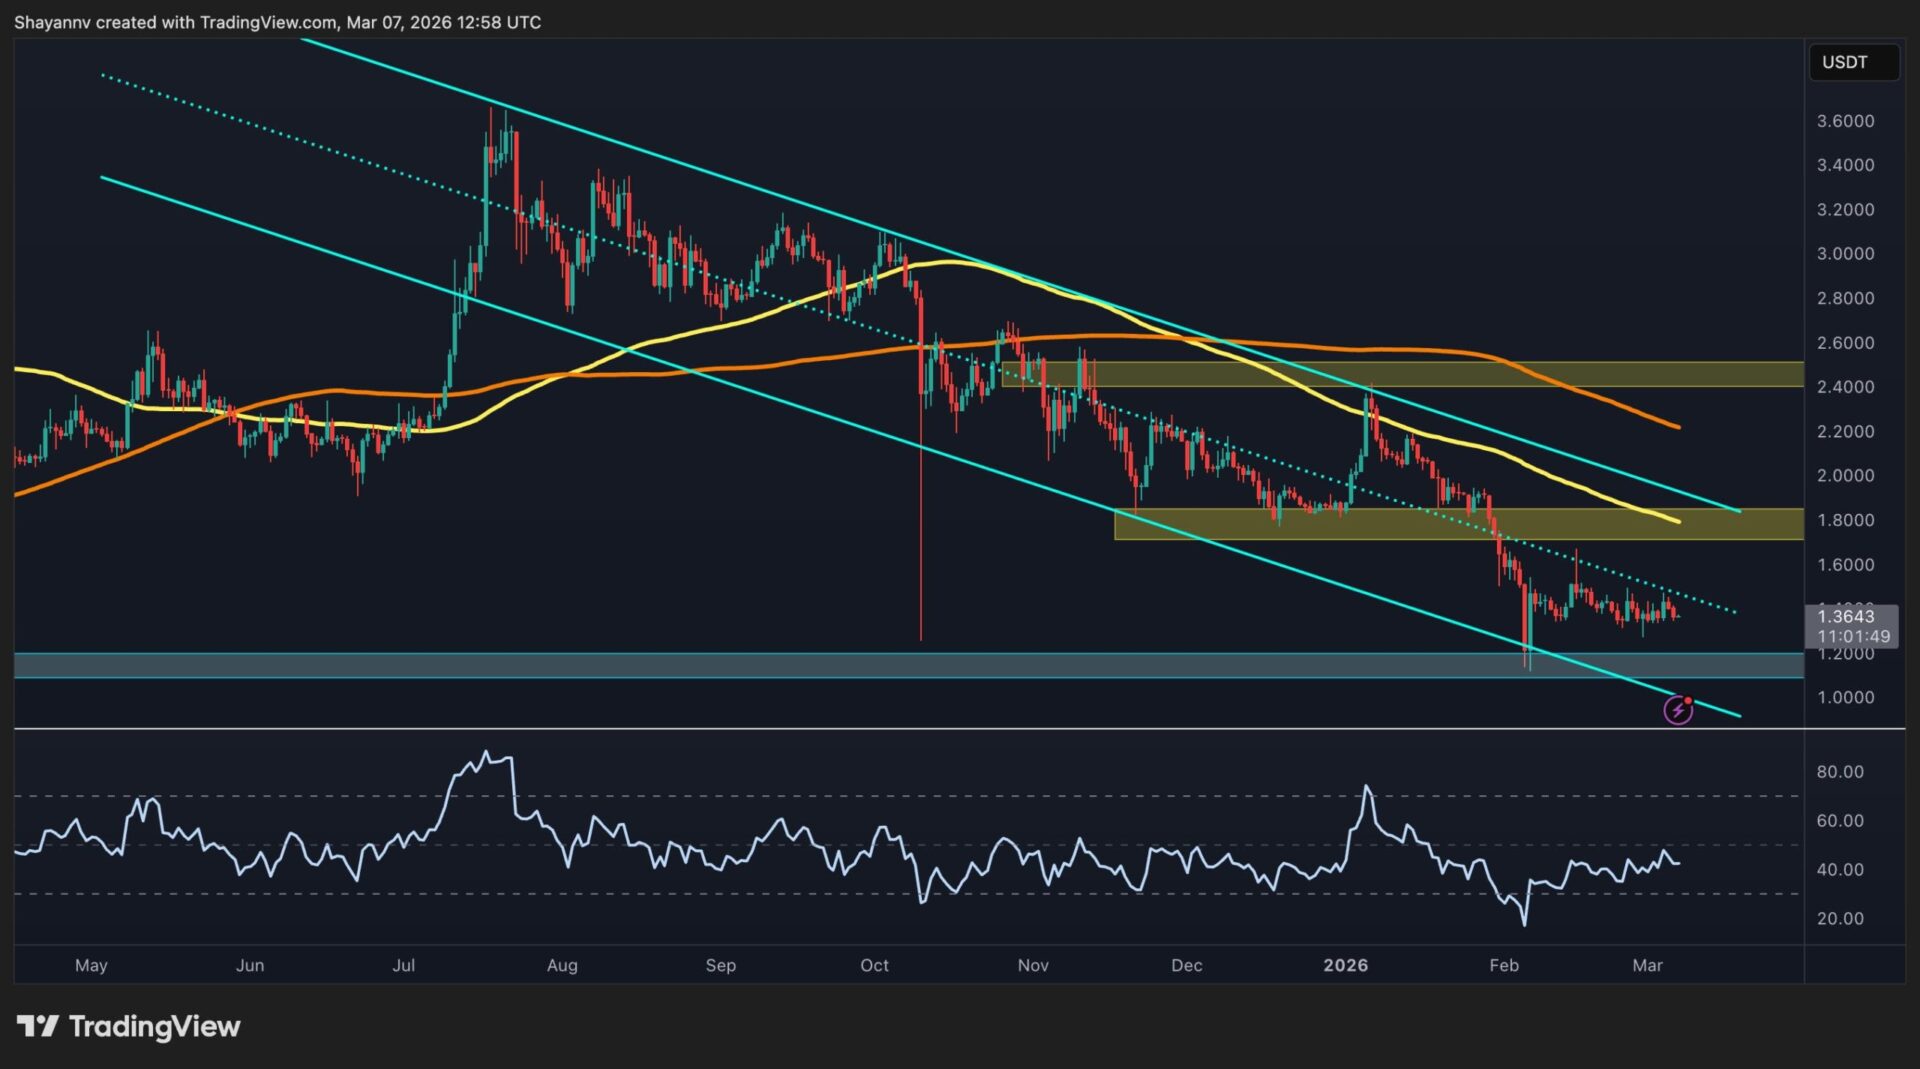
On the XRP/USDT chart, the asset remains trapped within a clear descending channel that has been in place for months, keeping the overall daily trend bearish. The price is currently hovering around $1.36 after failing to reclaim the mid-channel resistance and both the 100-day and 200-day moving averages, which are now acting as dynamic resistance around the $1.80 and $2.20 regions. As long as XRP stays below those levels, the structure points to continued weakness rather than a confirmed reversal.
From a support perspective, the $1.10 to $1.20 zone is the key area to watch in the short term, as it lines up with the lower boundary of the channel and has already attracted demand. If that region breaks decisively, the market could open the door for a much deeper decline.
On the upside, bulls would first need to recover the $1.80 zone before even thinking about a push toward the broader $2.40 to $2.50 resistance band. The RSI has also improved slightly and is no longer deeply oversold, but it still does not show the kind of momentum strength that would confirm a sustained bullish shift.
The BTC Pair
Against Bitcoin, XRP is also in a weak position and continues to trend lower while trading below both major moving averages. The pair is trading around 2,000 sats, with the price recently slipping back under the 2,200 to 2,400 sats resistance cluster created by the confluence of the 100-day and 200-day moving averages.
This makes the mentioned area a strong barrier for any bullish recovery attempt. The fact that XRP has failed multiple times to break and hold above that range shows that buyers still lack control.
The key support on this chart sits around 2,000 sats, and XRP is now testing that zone once again. A clean breakdown below it could expose the lower support areas around 1,500 sats and possibly even the 1,200 sats zone over time.
On the other hand, if buyers manage to defend current levels and push the pair back above 2,400 sats, the next upside target would likely be the 2,700 to 2,800 sats region, followed by the major resistance level near 3,000 sats. For now, though, the trend remains tilted to the downside, and XRP needs a clear reclaim of lost ground before the BTC pair can start looking structurally constructive again.
Binance Free $600 (CryptoPotato Exclusive): Use this link to register a new account and receive $600 exclusive welcome offer on Binance (full details).
LIMITED OFFER for CryptoPotato readers at Bybit: Use this link to register and open a $500 FREE position on any coin!
Disclaimer: Information found on CryptoPotato is those of writers quoted. It does not represent the opinions of CryptoPotato on whether to buy, sell, or hold any investments. You are advised to conduct your own research before making any investment decisions. Use provided information at your own risk. See Disclaimer for more information.